Tracking ocean temperatures in situ and from space
Written by: Florina Jacob and Laura Bastide
Why monitor water temperature in coral restoration zones?
Coral health is closely linked to water temperature. The consequences of rising temperatures on corals can be multiple and interrelated: corals are stressed, risking bleaching and death. Understanding about temperature variations enables us to adapt conservation decisions to better protect corals, which is at the heart of the projects supported by Coral Guardian.
How can we monitor the water temperature in our coral restoration zone?
This can be done with sensors installed directly in the water in our restoration zones, from which local teams collect data on a regular basis. To monitor temperature trends, both in the past and in real time and on different scales, we can use satellite observations and forecasts from ocean observation services such as the Copernicus Marine Service.
Locally, for the project around Hatamin Island, the team installed underwater temperature sensors at several locations in the marine protected area, between 2 and 6 meters deep. The sensors can be set to automatically collect temperatures periodically. The team collects the data on a weekly basis, in order to closely monitor trends and adapt coral restoration measures accordingly.
To complement these at-sea readings, our team can rely on satellite measurements of ocean parameters provided by the Copernicus Marine Service. This European Union ocean observation service offers a range of information tools on the state of the oceans, including downloadable data, interactive maps showing trends in several variables over time, analysis reports and ocean indicators for recent decades.
Linking data from the field with satellite data enables local readings to be compared with regional trends. This involves complementary work to put the data found by our teams into perspective.
For example, we compared the monthly trend in water temperatures in our restoration zone at Hatamin according to field monitoring and Copernicus Marine Services satellite tracking over the last 8 months (Figure 1). Both show the same trend: after an abnormal rise in temperatures in October and November, the water became cooler during the rainy season in January and February (a welcomed relief for corals to avoid stress!).
With the end of the rainy season, the water has been warming up since March. Both sets of data follow similar trends, except for May, when field temperatures appear higher than satellite data, hence the importance of monitoring both scales. With this information, the local team is closely monitoring the transplanted corals for possible bleaching events. For the moment, our cuttings are resisting temperature variations, with less than 10% of the coral cover monitored at Hatamin showing bleaching.
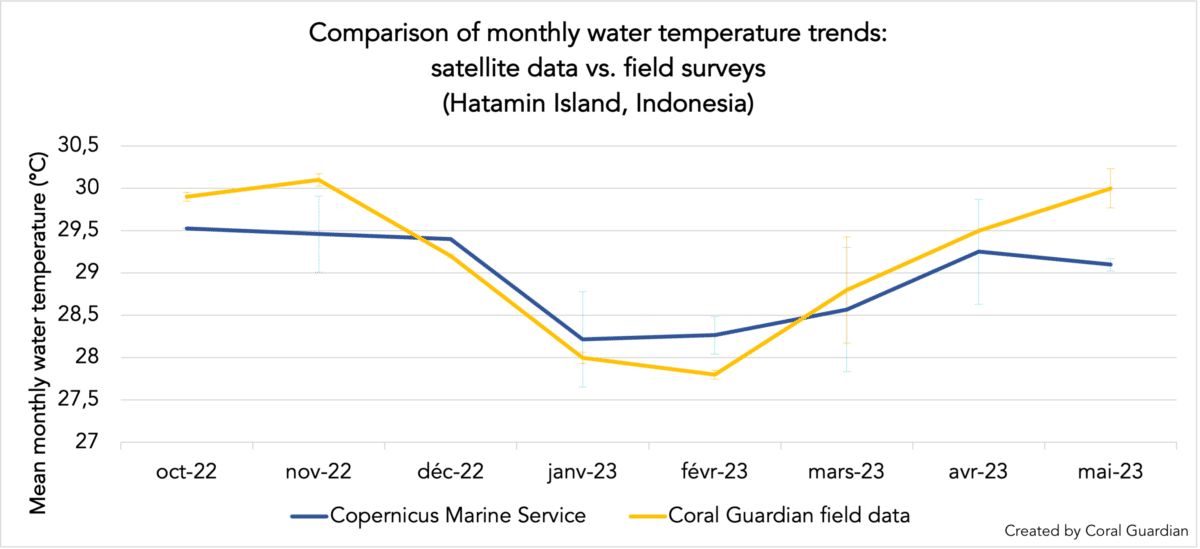
Figure 1: Comparison between average water temperatures around Hatamin Island, recorded in the field by the Coral Guardian team using sensors (yellow line), and satellite data provided by Copernicus Marine Services (blue line). Bars represent standard deviations. Satellite data credits: EU Copernicus Marine Service information (DOI: https://doi.org/10.48670/moi-00052).
What other water temperature monitoring programs exist?
The above-mentioned temperature anomaly trends have also been reported by other satellite observation programs, specialized in coral bleaching alerts, such as the Coral Reef Watch developed by NOAA (the U.S. National Oceanic and Atmospheric Administration) (Fig 2). This program provides global and regional information and visualization of water temperatures through satellite observations, in relation to coral reef health. It offers products that show the accumulation of thermal stress in coral reef zones, and notifies users through weekly alerts. In particular, for the period analyzed (Fig 1), there were bleaching alerts during November, December 2022 and March 2023.
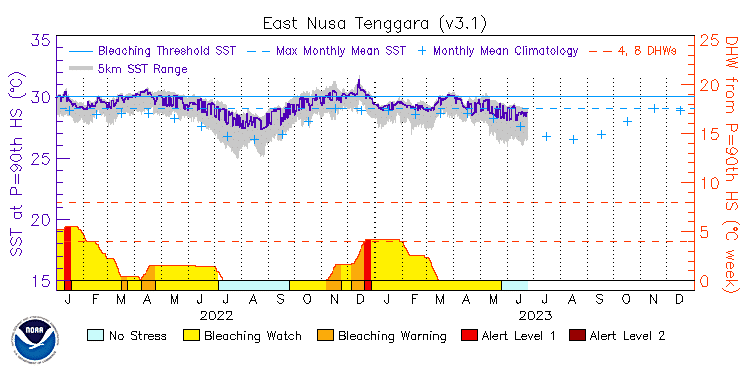
Fig 2. NOAA Coral Reef Watch product from NOAA East Nusa Tenggara for 2022-2023, time series of regional virtual satellite stations at 5 km. Sea surface temperature (SST), degree heating weeks (DHW) and stress level data (colors, bleaching alerts). Bleaching alerts depend on the 5 km hotspot (areas where the SST is above the maximum monthly average) and the 5 km DHW (accumulation of thermal stress in the area over the last 12 weeks). To see the full interpretation of these indicators, click here. Source: NOAA Coral Reef Watch Version 3.1.
So, there are many tools available for monitoring and visualizing satellite data, all with different uses and advantages.
What’s the long-term interest?
Satellite data are useful for identifying trends and understanding the factors behind coral bleaching observed in the field. For example, they can be used to determine the tolerance threshold for heat waves, in order to better prevent their impact on corals at different spatial scales. The advantage of satellite data is that it can be consulted in real time, on larger time scales, but also on larger spatial scales, enabling us to anticipate the movement of certain marine heat waves. The video below, for example, shows the water temperature increases in November and April-May around Hatamin Island (Nusa Tenggara region, Indonesia) over the last two years, enabling us to anticipate a potential heat wave in November 2023 that could affect the entire region.
Video 1. Video of water temperature changes in the area around Hatamin Island (Nusa Tenggara region, Indonesia) between June 2021 and June 2023. Generated with E.U. Copernicus Marine Service Information https://doi.org/10.48670/moi-00016
Are you curious? Explore the products, platforms, reports and catalog offered by Copernicus Marine Service !
Ces articles pourraient vous intéresser

Do clouds support us in coral protection?
Mystery in the Pacific: who saved coral reefs at the Society Islands? Could the presence of clouds in the sky improve the health of coral…
28 November 2023
Sponsor Spotlight : Zepp Health
Tell us a bit about yourself 🙂 At Zepp Health, we’re on a mission to empower people to take control of their well-being. We…
19 June 2023
Donor spotlight : Charline Auvinet
Tell us a bit about yourself 🙂 After graduating a few years ago, I’m now a crime fiction editor. In this job, I have discovered…
17 January 2023
Launch of the first participatory marine conservation project of the Mediterranean sea
We’re now located in the Mediterranean Sea with the launch of the first participatory marine conservation project in this region of the world. This project,…
17 February 2021